Speeding up Apache Flink string serialization
this article was originally written for the Namaste Tech blog,
but was never posted there. Cross-posted here with Namaste approval.
In Namaste Technologies we process millions of events per day coming from dozens of our online stores. These events are used for a lot of different things like reporting and A/B test results analysis, but the most important practical use case of this stream is personalized ranking for search results and product collections.
Each click made on a product will affect the future product rankings. The idea behind this approach is to make search results more relevant for customers, resulting in a smoother shopping experience and better business metrics like CTR and conversion rate, so a win-win situation for everyone.
Event bus
All the front-end activity happening on all the online stores we have comes into a single stream in AWS Kinesis. But front-end is not the only producer of events going there. Some of our internal backends also emit messages there, for example:
- On each inventory reindexing pass, which is happening a couple of times every hour, we emit short product description events into the bus to be able to know about product titles, prices, discounts and so on.
- On each search backend request, we emit a descriptor event, explaining why these products were ranked in this way.
There are multiple consumers from this event bus, but all of them are implemented as an Apache Flink streaming jobs.
Apache Flink
Apache Flink is a framework for writing stateful streaming analytical applications, which can handle for you the most complicated and scary parts of the job.
- How to persist a state inside your job? A good example of stateful application will be a task to emit a number of product page views in the last 30 days on each page view: to compute this number properly you need to store intermediate data somewhere. And this intermediate data can be huge, so you need to store it in a distributed fashion.
- How to handle failures? What if you decided to redeploy your job, but cannot afford dropping (or duplicating) messages in the stream?
- How to scale in case when you have too many events?
All these problems are mostly solved within the Apache Flink framework.
The lag problem
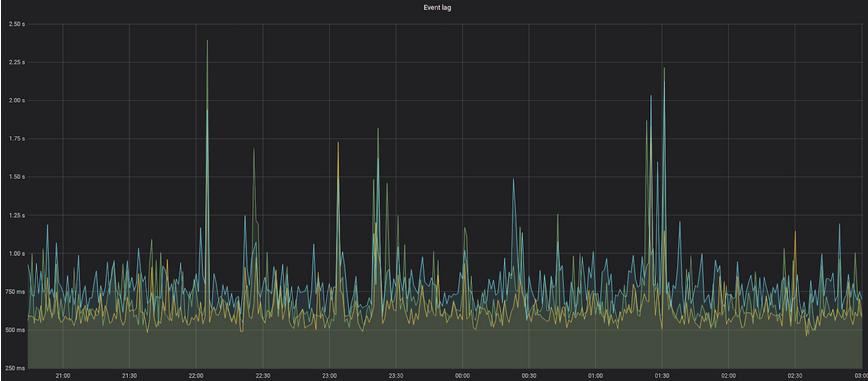
Once, while monitoring the throughput of our search personalization job, we noticed than the job sometimes is not being able to process all the messages coming from the event bus in real time, slowly lagging for a couple of minutes, and then being able to start keeping up with the influx.
From the business perspective this means that we are not able to do a proper realtime search results personalization, as all the data we use there will be late for a couple of minutes. Considering that a typical ecommerce session lasts for a very short period of time, this issue may significantly worsen the business metrics and customer satisfaction: you will get generic search results instead of personalized ones.
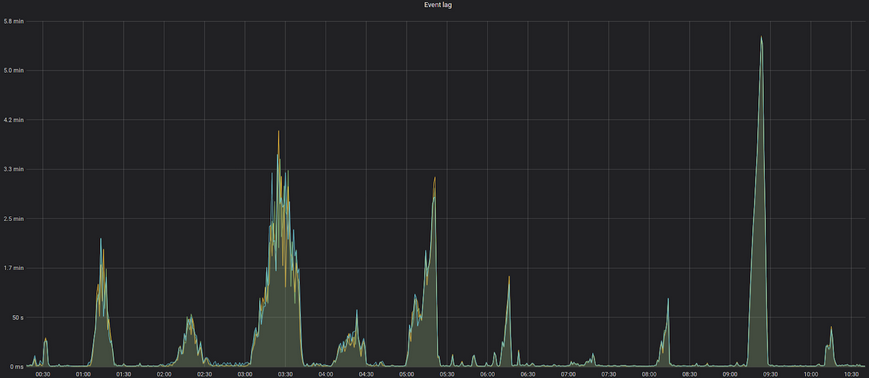
As you can see from the image, once in an hour there is a spike with the event processing lag, going up from acceptable sub-second values to something terrible like 2-5 minutes. But why these events are happening?
Considering the periodic nature of these lags, you may suspect that someone (or something) emits a huge amount of events in a short period of time into the event bus. As event but is a shared resource and guarantees exact ordering for all the events, we cannot continue processing front-end events until we consume this mystical batch.
Reindexing job
As I’ve mentioned before, we do a full periodical reindexing of the store inventory, so search results and product collection listings will reflect the actual information about product availability and parameters. But as our personalization data processing application needs to be in sync with the inventory, we emit per-product descriptors into the event bus, so we will know the actual product prices, availability and so on.
But what can go wrong with this approach if you have 100000+ products in your inventory? As you may guess, this huge batch of product descriptors will flood the whole event bus and block all other realtime messages coming from the front-end.
This issue can be fixed with multiple approaches:
- Throttle the event source, so it won’t flood the bus that hard. But then it will increase reindexing times.
- Have a separate event bus for reindexing events, throttling the consumer. But this approach may require additional logic to have synchronisation between these two streams.
- As 100k products is not that a large number, dive deep into the things Apache Flink does while processing these messages, and fix the performance issue itself.
As a true hardcore engineers, we took the third approach.
Flame graphs
In the area of software performance engineering, there is a rule of three W:
- Where is the issue happening?
- Why is it happening?
- What can be done to improve the situation?
And each next question in this list strictly depends on the previous one. So a typical start here is to reliably reproduce the situation, point a profiler application on your code and then start digging deeper. But how easily can you locally reproduce the performance issue happening once in a while in the production, and between multiple complex systems?
So instead of this, we decided to run profiling directly on our production Apache Flink nodes. For sure, there are plenty of JVM profilers available like JMC, YourKit and so on. But they usually have some visible overhead and rarely can easily make an overview of your application’s hot parts.
But recently there was a new visual approach proposed, which really simplifies the initial performance analysis: flame graphs.
Flame graph is a diagram showing how much time you application spent in a specific function call. To draw this, we need to sample what function is currently using the CPU (and the complete chain of its callers), and draw them in a way, so the more frequently the function has been running, the wider the bar representing it.
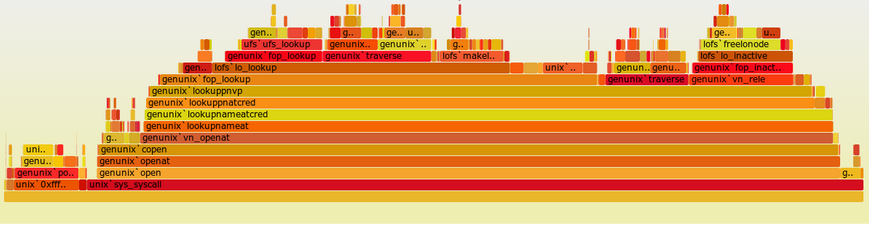
We set up a periodic 1 minute flamegraph sampling process on all the Apache Flink nodes and started to wait for the issue to happen again. And at the moment of the lag happening, we saw the following graph:

The two areas highlighted with red surprised us a bit: it was text string serialization and deserialization: as we receive a single stream of events and then splitting it per-merchant, we need to redistribute it between different nodes over the network. So it’s expected that there should be some serialization overhead, but not that huge.
If you try to understand, what type of strings in the product descriptor are being serialized here, so there are quite a lot of them:
- Product title
- Tags, which are usually later expanded to different per-product fields
- Category paths
- Color, brand, size, etc.
Actually, almost 90% of all the fields in the product descriptor are strings.
String serialization
We’re definitely not the first people ever who tried to send text strings over the network. The problem of converting a text into a sequence of bytes is a bit more complicated as it may seem from the first sight, as you need to take into account different character encodings and languages, but Apache Flink already have this feature implemented.
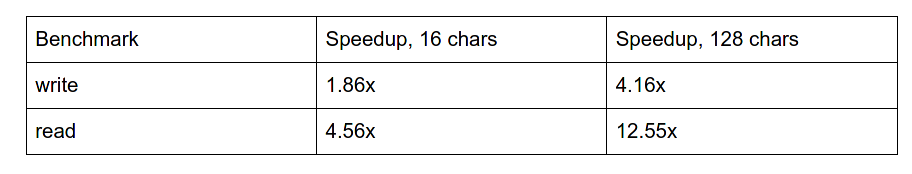
To have some sort of baseline, we compared Flink’s string serializer with the one present in the Java VM, and got some weird results:
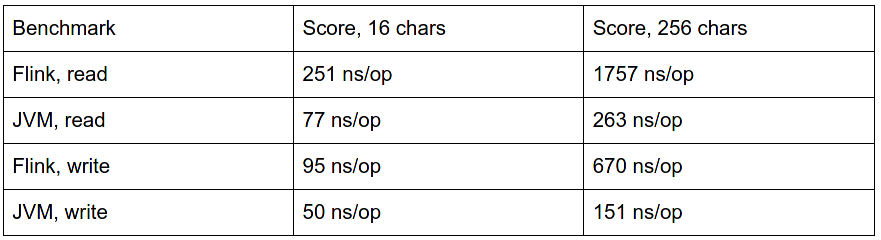
So Flink’s implementation was 4x-7x slower on encoding and 2x-4x on decoding, which is quite a significant number. Both implementations are looking mostly similar, but their performance characteristics are dramatically different. Why?
How CPU works
Almost all the CPUs produced in the last 15 years are:
- Superscalar: can process multiple operations at the same time, even on a single core. For example, if operation A waits for some data to be fetched from memory, CPU, instead of doing nothing, can decide to execute another operation B if it’s not dependant on the results of the operation A.
- Speculative: if CPU receives a branching instruction, it can start executing code from both branches at the same time before it is able to compute which branch it must actually follow.
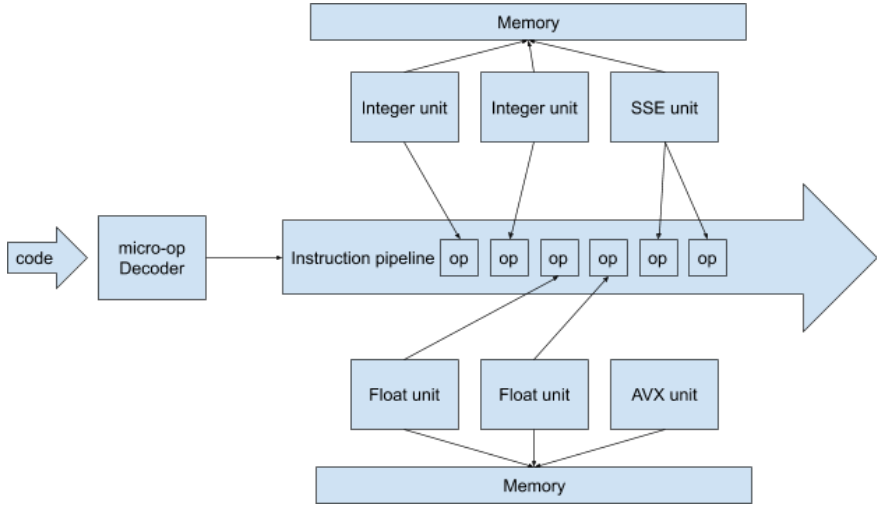
So when you execute some code, your CPU will do the following things:
- Decode the application instructions into a sequence of micro-operations the CPU can actually execute.
- Put the stream of these micro-operations into the instruction pipeline, so all the execution units can access these micro-ops.
- Int/Float/SSE/AVX units can fetch different instructions from pipeline and start executing them. But, for example, executing a number increment operation will require fetching this number from memory, then doing actual increment, and then putting it back to memory.
- In the middle of operation execution, CPU unit may find itself being blocked on memory access, so it can occupy itself by executing the next operation from the pipeline, while it’s waiting for the memory response.
But this speculative and superscalar magical approach is working nice only if there is no data dependency between your operations. So, for example, if you’re computing something iteratively, and for the next iteration you need the result from the previous one, you’re out of luck.
Flink string serialization
To serialize a text string into a sequence of bytes (and back), Flink:
- iterates over all the characters in the string,
- converts each of them into a sequence of bytes,
- writes each byte into the output byte stream.
In a pseudo-code it may look like this:
Foreach (character in string) {
   Foreach (byte in character.bytes) {
     outputStream.append(byte);
   }
}
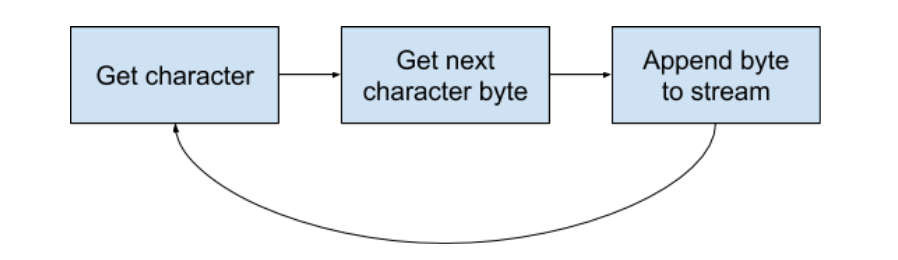
As you may suspect, the idea of writing bytes into a byte stream one-by-one may not play nice with the speculative and superscalar architecture of modern CPUs: to append the next character, you need to finish appending the previous one, as otherwise you may have incorrect character ordering in the output stream.
But what if we will help CPU a bit by adding an intermediate buffering right before the output stream, and then flush the whole buffer to the output stream at the end? So from the CPU perspective, the execution flow will look like the following diagram:
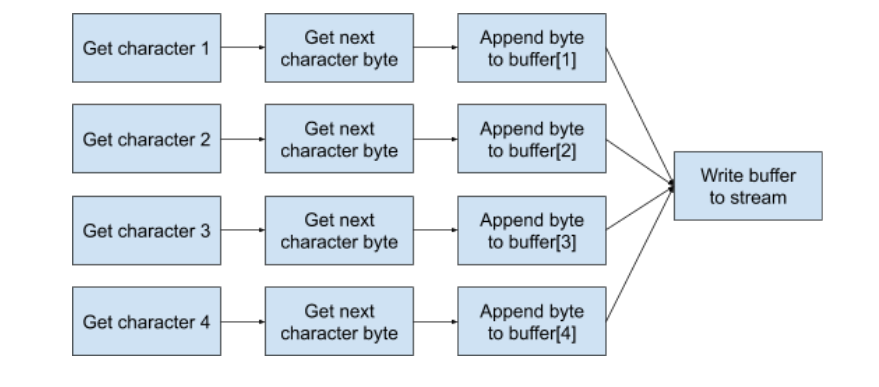
We won’t be blocked on the output stream and can process as much characters as hardware can handle in parallel.
After applying this minor change, we noticed a significant improvement on string serialization throughput in our microbenchmarks.
For more generic benchmarks measuring the whole job throughput we also saw almost 2x improvement in performance.
Going open
The easiest technical solution for the problem we had could be just applying the given change to the Flink version running in the production and calling it a day. But it may not be the best solution in a long perspective: For each new Flink release we will need to backport our change, which may be not so trivial. There may be some corner-cases with the proposed improvement which we were not able to predict.
So we did a proper Pull Request to the mainline Apache Flink project: https://github.com/apache/flink/pull/10358
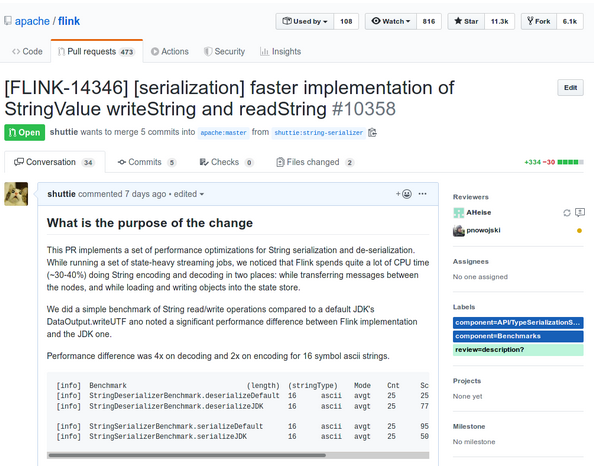
While working on the PR:
- We found a performance regression in the proposed algorithm, which was sometimes slower on short strings: intermediate buffer allocation can take too much time if there is only 1 or 2 characters in the string.
- Apache Flink also has a suite of performance regression tests with some typical jobs. This suite is being run every night and can highlight performance trends and issues with the main codebase. We had to also make a PR to this sub-project to show the impact of the change: https://github.com/dataArtisans/flink-benchmarks/pull/36
- We received quite a lot of questions and comments about the possible corner cases, so we significantly expanded the number of tests used to validate that we didn’t break anything.
The proposed improvement will be the part of Apache Flink 1.10, which is going to be released somewhere in January 2020.
Results
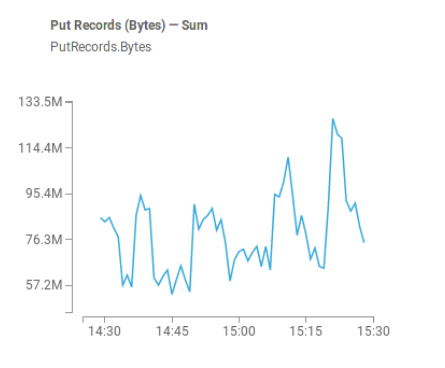
After we deployed the change in our production Apache Flink cluster, we saw a much better situation with the search reranking lag:
Now it’s between 500ms and 1s, which is an acceptable value from the business perspective: each customer action will affect search ranking in the sub-second time.